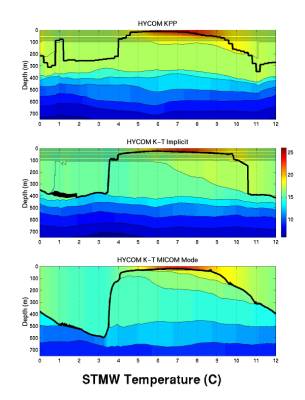
One
annual cycle of upper ocean
variability
is illustrated by
imaging
the temperature field
and
superimposing the vertical
coordinate
interfaces and the
mixed
layer base (thick line).
The
annual cycle at point STMW
represents
variability in the
subtropical
mode water formation
region
at the northern edge of
the
subtropical gyre. As
illustrated
earlier, the mode water
temperature
is most accurate in
the
KPP simulation, but
substantially
too cold in the
MICOM
mode simulation.