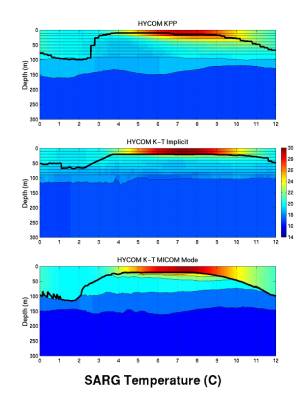
One
annual cycle of upper ocean
variability
is illustrated by
imaging
the temperature field
and
superimposing the vertical
coordinate
interfaces and the
mixed
layer base (thick line).
The
annual cycle at point SARG
represents
variability in the
interior
western subtropical gyre.
All
three simulated fields are
very
similar.