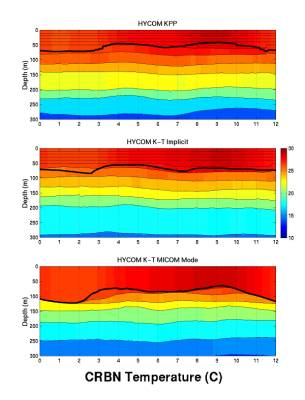
One
annual cycle of upper ocean
variability
is illustrated by
imaging
the temperature field
and
superimposing the vertical
coordinate
interfaces and the
mixed
layer base (thick line).
The
annual cycle at point CRBC
represents
variability in the
Caribbean
Sea. This variability
is
very similar in the three cases.