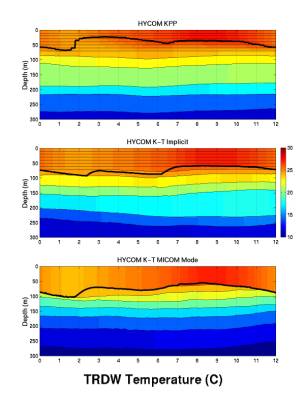
One
annual cycle of upper ocean
variability
is illustrated by
imaging
the temperature field
and
superimposing the vertical
coordinate
interfaces and the
mixed
layer base (thick line).
The
annual cycle at point TRDW
represents
variability in the
North
Atlantic Trade Wind belt
at
the southern edge of the
subtropical
gyre. Results are
generally
similar, but the KPP
mixed
layer tends to be thinner
than
in the two K-T mixing
cases.