In
this and the seven subsequent
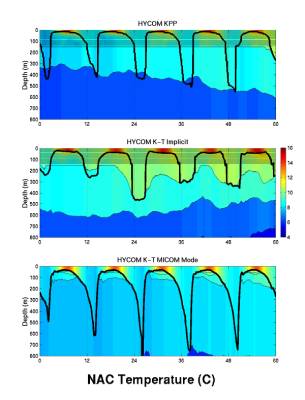
slides,
five annual cycles of upper
ocean
variability are illustrated by
imaging
the temperature field
and
superimposing the vertical
coordinate
interfaces and the
mixed
layer base (thick line).
Differences
in upper-ocean
temperature
can be large at grid
points
located in frontal zones and
the
boundary regions between
gyres.
Horizontal displacement
of
these oceanographic features
among
simulations can lead to
substantial
T differences. In
general,
smaller differences are
observed
at grid points located
at
gyre interiors.
At
the NAC grid point, low-
frequency/secular
variability in the
subtropical/subpolar
gyre boundary
is
evident.