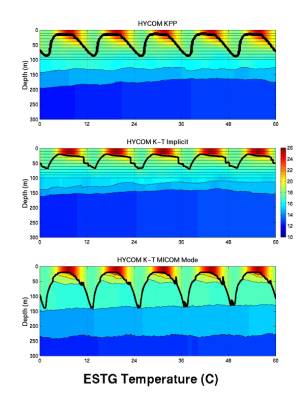
In
this and the seven subsequent
slides,
five annual cycles of upper
ocean
variability are illustrated by
imaging
the temperature field
and
superimposing the vertical
coordinate
interfaces and the
mixed
layer base (thick line).
At
the ESTG grid point,
variability
within the interior
eastern
subtropical gyre does not
display
long-term climate drift.