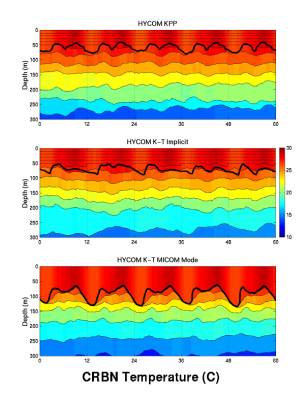
In
this and the seven subsequent
slides,
five annual cycles of upper
ocean
variability are illustrated by
imaging
the temperature field
and
superimposing the vertical
coordinate
interfaces and the
mixed
layer base (thick line).
At
the CRBN grid point, little
long-term
variability is observed
in
the Caribbean Sea.