In
this and the seven subsequent
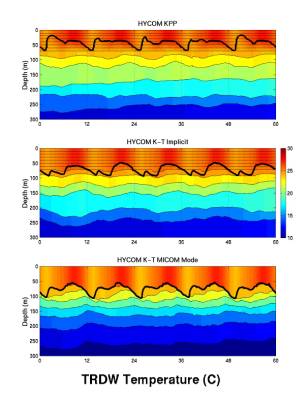
slides,
five annual cycles of upper
ocean
variability are illustrated by
imaging
the temperature field
and
superimposing the vertical
coordinate
interfaces and the
mixed
layer base (thick line).
At
the TRDW grid point, results
are
generally similar in the
North
Atlantic Trade Wind belt
at
the southern edge of the
subtropical
gyre. The KPP mixed
layer
tends to be thinner than in
the
two K-T mixing cases. Long-
term
climate drift is not observed.