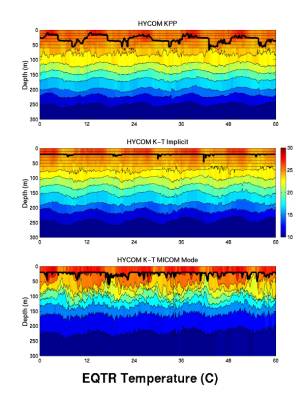
In
this and the seven subsequent
slides,
five annual cycles of upper
ocean
variability are illustrated by
imaging
the temperature field
and
superimposing the vertical
coordinate
interfaces and the
mixed
layer base (thick line).
At
the EQTR grid point, results
are
generally similar at the Equator,
but
summer upper ocean cooling
due
to enhanced equatorial
upwelling
is stronger in the
MICOM
mode case.