|
|
|
|
|
|
|
|
|
|
|
|
|
|
|
|
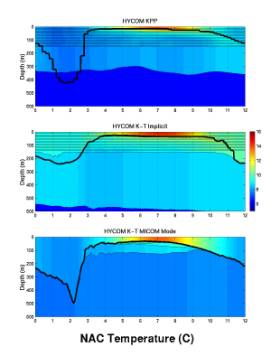
In
this and the seven subsequent
|
|
slides,
one annual cycle of upper
|
|
|
ocean
variability is illustrated by
|
|
imaging
the temperature field
|
|
and
superimposing the vertical
|
|
coordinate
interfaces and the
|
|
|
mixed
layer base (thick line).
|
|
Differences
in upper-ocean
|
|
temperature
can be large at grid
|
|
points
located in frontal zones and
|
|
the
boundary regions between
|
|
gyres.
Horizontal displacement
|
|
of
these oceanographic features
|
|
among
simulations can lead to
|
|
|
substantial
T differences. In
|
|
general,
smaller differences are
|
|
observed
at grid points located
|
|
|
at gyre
interiors.
|
|
|
The
annual cycle at point NAC
|
|
represents
variability in the
|
|
|
boundary
zone between the
|
|
subtropical
and subpolar gyres.
|
|