|
|
|
|
|
|
|
|
|
|
|
|
|
|
|
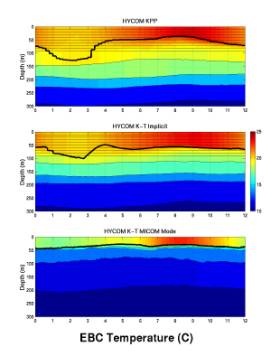
One
annual cycle of upper ocean
|
|
variability
is illustrated by
|
|
|
imaging
the temperature field
|
|
and
superimposing the vertical
|
|
coordinate
interfaces and the
|
|
mixed
layer base (thick line).
|
|
|
The
annual cycle at point EBC
|
|
represents
variability in the
|
|
eastern
boundary current off
|
|
|
northwest
Africa. In a narrow
|
|
zone off NW
Africa, the
|
|
relatively
warm nearsurface layer
|
|
is
much thinner in the MICOM
|
|
|
mode
simulation than in the
|
|
two
hybrid coordinate simulations.
|
The
annual cycle of mixed layer
|
|
|
temperature
is much larger in the
|
|
MICOM
mode simulation,
|
|