
|
|
|
|
|
|
|
|
|
|
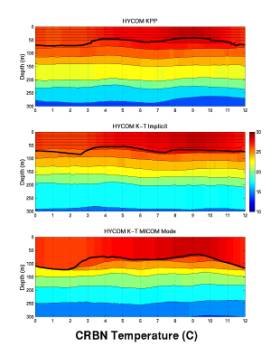
| One
annual cycle of upper ocean |
|||||||||
| variability is
illustrated by |
|||||||||
| imaging
the temperature field |
|||||||||
| and
superimposing the vertical |
|||||||||
| coordinate
interfaces and the |
|||||||||
| mixed
layer base (thick line). |
|||||||||
| The
annual cycle at point CRBC |
|||||||||
| represents
variability in the |
|||||||||
| Caribbean
Sea. This variability |
|||||||||
| is
very similar in the three cases. |
|||||||||