
|
|
|
|
|
|
|
|
|
|
|
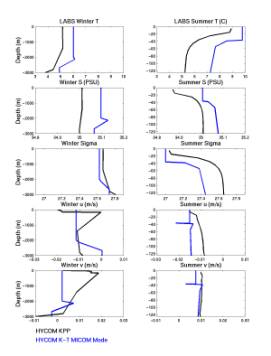
| In
this and the seven subsequent |
||||||||||
| slides,
vertical profiles of T, S, |
||||||||||
| sigma,
u, and v are presented for |
||||||||||
| the
10 grid points. The vertical |
||||||||||
| profiles
produced by the non-slab |
||||||||||
| KPP
mixing algorithm are |
||||||||||
| compared
to the vertical profiles |
||||||||||
| produced
by the slab K-T model |
||||||||||
| when
HYCOM is run in MICOM |
||||||||||
| mode.
Winter and summer profiles |
||||||||||
| are
compared and contrasted. |
||||||||||
| Grid
point LABS represents the |
||||||||||
| interior
Labrador Sea, |
||||||||||